Main Page
Contents
Welcome to the Scan-TeFo & HyMS wiki
This wiki contains models, parts lists, assembly instructions and other documentation that allows to build and set up our Scanned Temporal Focusing (Scan-TeFo) Microscope Prevedel et al., Nature Methods (2016), as well as our more recent and advanced Hybrid Multiplexed Sculpted Light (HyMS) Microscope Weisenburger et al., Cell (2019).
In what follows, we summarize the Scan-TeFo and HyMS approaches and provide links to example datasets and technical documentation.
Hybrid Multiplexed Sculpted Light (HyMS) Microscopy
Scanned Temporal Focusing (s-TeFo) Microscopy
Scanned Temporal Focusing (s-TeFo) is a method based on light sculpting that enables unbiased single and dual-plane high-speed calcium imaging, as well as in vivo volumetric calcium imaging of volumes near the size of a mouse cortical column (500x500x500 µm) at single-cell resolution and fast volume rates (3 - 6 Hz). This is achieved by tailoring the point-spread function of our microscope to the structures of interest while maximizing the signal-to-noise ratio while using a home-built fiber laser amplifier with pulses that are synchronized to the imaging voxel speed. Together, they enable near-simultaneous in-vivo recording of calcium dynamics of several thousand active neurons across cortical layers and in the hippocampus of awake behaving mice.

s-TeFo, combines three key ideas; (1) excite the minimally required number of voxels per unit volume necessary to resolve the structure of interest, (2) ensure a near-isotropic 3D shape of these excitation voxels and (3) maximize the obtainable fluorescence signal-to-noise from each voxel by synchronizing the laser pulse repetition to the voxel acquisition rate. These conditions increase the volume acquisition rate by eliminating the unnecessary oversampling in the lateral (x,y) plane as is some of the applications of conventional 2PM just for obtaining the necessary axial localization of excitation. At the same time, it allows maximizing the obtainable fluorescence signal-to-noise for a given average excitation power. The enlarged sculpted PSF volume in combination with the one pulse per voxel excitation scheme allows for a higher total signal-to-noise ratio from each GCaMP-expressing neuron at the same excitation power density. This is in essence because larger voxels lead to a higher total collected fluorescence from each voxel and also because at a lower total number of voxels a lower repetition rate can be used – while maintaining a one-pulse per pixel excitation condition – from which the signal benefits non-linearly. Thus, for the same obtainable signal to noise ratio we can either reduce the laser pulse energy per unit area and time (J/(µm2/s)) which in turn improves cell viability or the higher obtainable signal-to-noise ratio in case of s-TeFo can be used to reduce the voxel dwell time and thereby speed up the voxel acquisition rate. Furthermore, as shown previously, using temporal focusing also provides the additional advantage that the axial confinement of excitation is more resilient to aberrations and tissue scattering compared to conventional two-photon excitation.
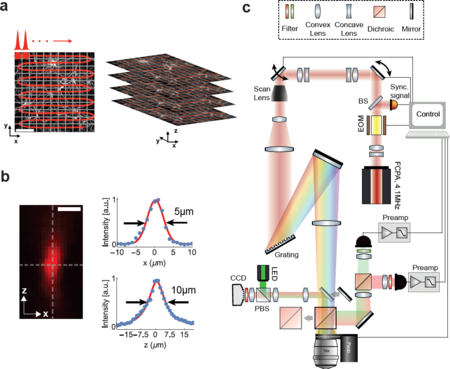
A schematic of our s-TeFo imaging approach is depicted in Fig. 1a along with a measurement of the corresponding 3D PSF (Fig. 1b), and the schematic of the setup (Fig. 1c). The enlarged 3D PSF has about a 130-fold increased excitation volume of ~130 µm3 compared to the PSF in diffraction-limited scanning. This required a corresponding increase in pulse energy in order to maintain a comparable power density (J/(µm2/s)), which in turn necessitated the development of an alternative femtosecond laser that can provide sufficient pulse energies at repetition rates equal to or higher than the image acquisition rate. Whereas a repetition rate higher than the imaging/voxel rate would be possible in principle, the highest signal-to-noise is achieved with a one-pulse-per-voxel excitation approach, as this scheme optimizes the obtainable signal and prevents integration of detector read noise that can accumulate when fluorescence from multiple pulses is integrated.

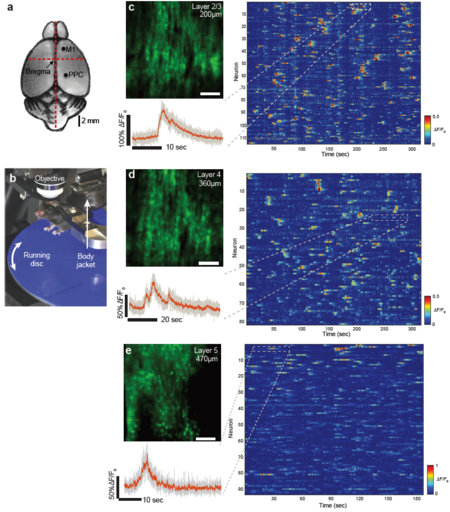
As a first demonstration of the capabilities of our s-TeFo imaging system, we performed two-photon calcium imaging in Layer 2/3 (200 µm depth) and Layer 4 (360 µm depth) of the posterior parietal cortex (PPC) of awake head-fixed mice expressing the GCaMP6m calcium sensor (see Fig. 2). The mice were placed on a home-built mount that includes a running disk designed to minimize the effects of brain movements. The optimized voxel acquisition and excitation scheme of our s-TeFo system allowed us to record the activity of neurons at each plane at 158 Hz. We typically recorded between 150 and 200 neurons in our imaging field-of view (FOV, 500x500µm) of which 80-120 showed activity, depending on imaging depth and the animal’s behavior. Despite the high frame rate and low pixel dwell time (~250 ns), we could obtain sufficient signal-to-noise to extract calcium traces from the data with high. Our demonstrated frame rate of ~160 Hz and field-of-view of 500x500 µm, inside scattering brain tissue, outperforms previously demonstrated, unbiased imaging systems based on scanning two-photon microscopy when our obtained FOV, speed and depth (down to 500 µm) are considered collectively.

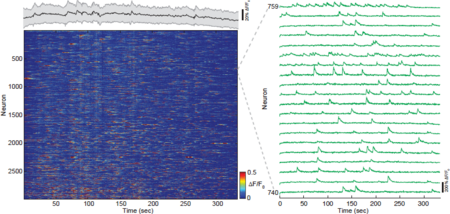
To demonstrate the full potential of our s-TeFo method for fast and unbiased, three-dimensional imaging, we performed continuous volumetric Ca2+-imaging over a V-FOV of 500x500x500 µm in the PPC of awake behaving mice at a volume rate of 3 Hz (Video 1 and Fig. 3). This volume covers a major portion of a cortical column, and includes layers I-V in the mouse PPC cortex 52. Most individual Ca2+-traces show pronounced maximum fluorescence changes (∆F/F0), exemplifying the quality and signal-to-noise of the recording. In our data sets we typically identified several thousand (~2000-4000) neurons within our recording volumes, out of which a large portion (~60 %) showed activity during a typical recording time duration of ~ 5 min.
Relevant publications
Robert Prevedel, Aart J. Verhoef, Alejandro J. Pernia-Andrade*, Siegfried Weisenburger*, Ben S. Huang, Tobias Nöbauer, Alma Fernández, Jeroen E. Delcour, Peyman Golshani, Andrius Baltuska and Alipasha Vaziri, "Fast volumetric calcium imaging across multiple cortical layers using sculpted light", Nature Methods 13, 1021 – 1028 (2016). (Download)