File:Fig2.png

Original file (804 × 914 pixels, file size: 755 KB, MIME type: image/png)
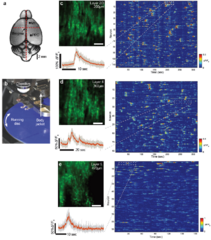
Figure 2: High-speed single plane Ca2+-imaging in mouse posterior parietal cortex at 158fps using s-TeFo. (a) Sketch of the adult mouse brain, indicating the injection and imaging sites. M1 primary motor cortex, PPC posterior parietal cortex. Scale bar is 2mm. (b) Photograph of the animal mounted below the imaging objective via a head bar holder on a homebuilt running disc. The animal is additionally supported by a stabilizer attached to a body jacket. (c) Top left: Time averaged intensity projection image at Layer 2/3 (200µm depth) in mouse PPC expressing GCAMP6m. Right: Calcium traces of 114 active neurons identified in this plane. Each row shows the time-series activity of an individual neuron. Color indicates percent fluorescence changes (∆F/F0); scaling is indicated by the color bar on the right. Typical calcium transients consisted of an estimated (30±10)*103 detected photons (~3 photons per digitized count). Bottom left: Zoom-into a single trace (dashed box) is shown. Grey: raw data, red: moving average of 10 time points. (d) Same as in c, but at Layer-4 (depth of 360µm) in the same animal. (e) Same as in c, but at Layer-5 (depth of 470µm) of a GCAMP6f expressing mouse. Scale bar is 100µm in c, d. Representative recordings out of ten data sets.
File history
Click on a date/time to view the file as it appeared at that time.
| Date/Time | Thumbnail | Dimensions | User | Comment | |
|---|---|---|---|---|---|
| current | 15:31, 1 November 2016 | | 804 × 914 (755 KB) | Admin (talk | contribs) | Figure 2: High-speed single plane Ca2+-imaging in mouse posterior parietal cortex at 158fps using s-TeFo. (a) Sketch of the adult mouse brain, indicating the injection and imaging sites. M1 primary motor cortex, PPC posterior parietal cortex. Scale bar... |
You cannot overwrite this file.
File usage
The following 2 pages use this file: